Team performance metrics in TQM: how to measure and
improve team effectiveness
Team performance metrics in TQM measure how effectively a quality improvement team is functioning — separate from the quality outcomes the team is working to achieve. The five team effectiveness metrics are: Project completion rate (percentage of improvement projects completed within the planned timeline — measures whether teams are structured and resourced adequately to finish what they start), Milestone adherence rate (percentage of project milestones met on time — reveals planning accuracy and identifies phases where teams consistently lose time), Solution implementation rate (percentage of team recommendations that are implemented — a low rate signals authority or resource gaps that prevent teams from acting on their findings), Gain sustainment rate (percentage of improvements that are still delivering results 6 months after project close — measures control plan effectiveness and process owner engagement), and Team member participation rate (percentage of team members actively contributing at each session — measures team design quality and meeting effectiveness).
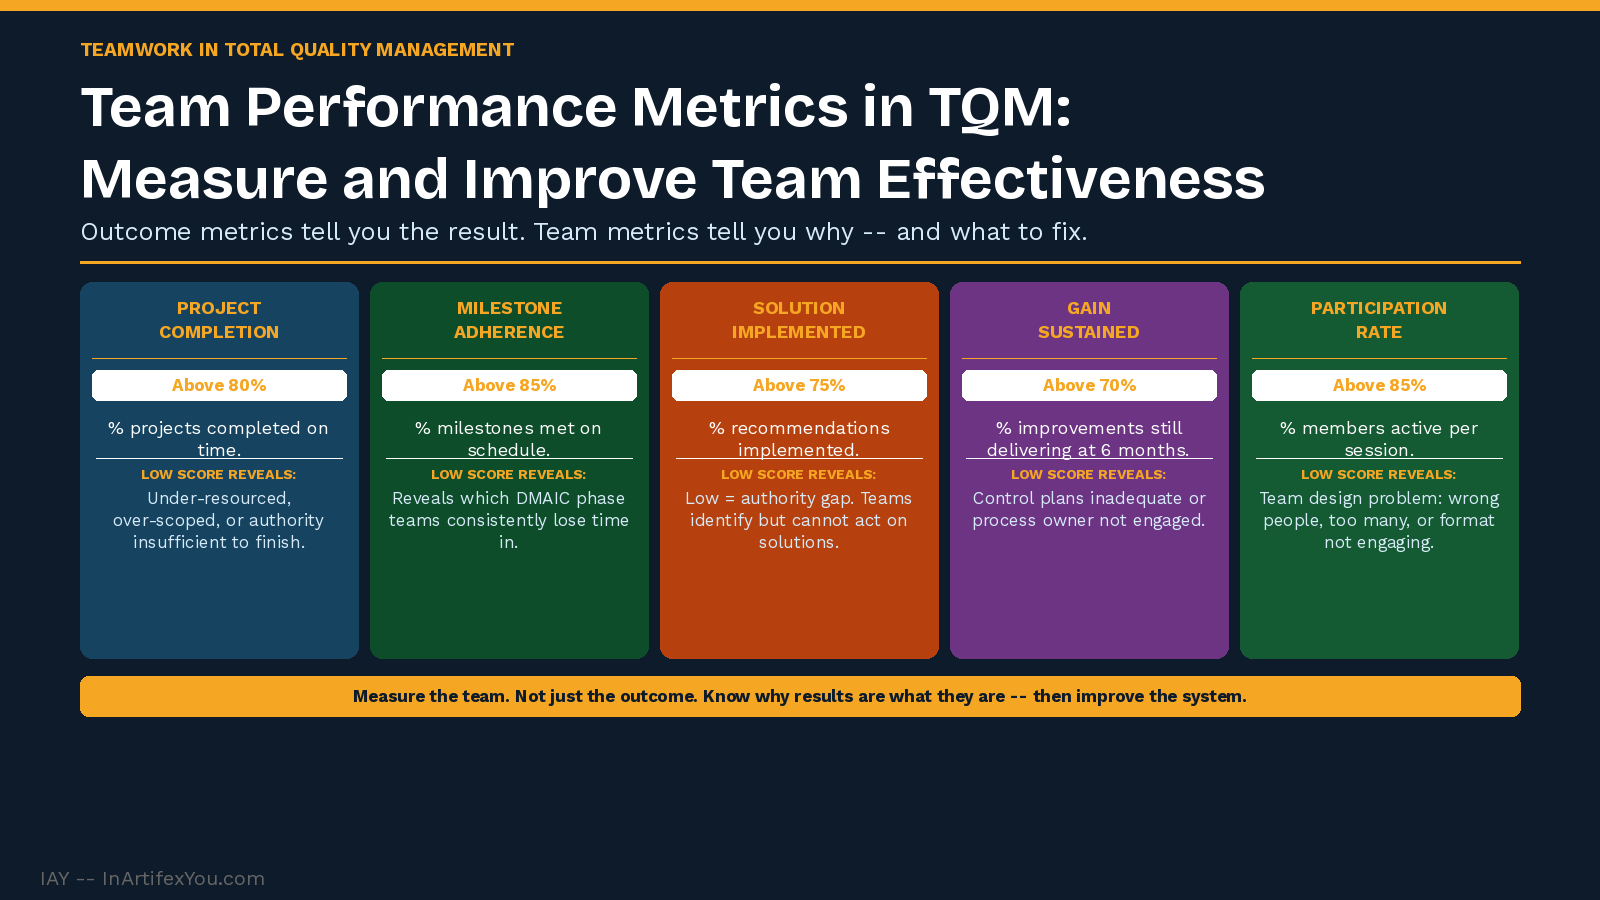
Team performance metrics in TQM serve a different purpose than quality outcome metrics. Outcome metrics measure whether quality is improving. Team performance metrics measure whether the teams responsible for improvement are functioning effectively — and if not, where the breakdown is occurring. An organization that only measures quality outcomes cannot distinguish between a team that is working well on the wrong problem and a team that is working poorly on the right problem. Both produce the same outcome metric: no improvement. Team performance metrics reveal which one is happening.
The Five Team Performance Metrics
|
Metric |
Formula |
Target |
What Low Performance Reveals |
|
Project Completion Rate. |
(Projects completed on time / Total projects started) x 100. |
Above 80%. |
Teams are under-resourced, over-scoped, or lack authority to complete their work. |
|
Milestone Adherence Rate. |
(Milestones met on time / Total milestones) x 100. |
Above 85%. |
Specific DMAIC phases where teams consistently lose time — usually Analyze or Improve. |
|
Solution Implementation Rate. |
(Solutions implemented / Solutions recommended) x 100. |
Above 75%. |
Authority gaps: teams identify solutions they cannot implement. Organizational barrier. |
|
Gain Sustainment Rate. |
(Improvements sustained at 6-month review / Total improvements closed) x 100. |
Above 70%. |
Control plans are inadequate or process owners are not engaged in sustaining. |
|
Participation Rate. |
(Active participants per session / Total team members) x 100. |
Above 85% per session. |
Team design problem: wrong people, too many people, or meeting format not engaging. |
Using Team Metrics to Improve the Improvement System
- Low project completion rate: audit the last 5 incomplete projects — identify the common failure point. Scope too large, resources not protected, or authority insufficient are the three most frequent causes.
- Low milestone adherence in Analyze phase: teams are spending too long on root cause analysis without data discipline. Introduce a defined root cause confirmation protocol — no root cause advances without supporting data.
- Low solution implementation rate: escalate to Champion level. When more than 25% of team recommendations are not implemented, the organizational barriers preventing implementation must be addressed — not just measured.
- Low gain sustainment rate: audit control plans for the projects that lost their gains. The most common finding is that the control plan was not transferred to the process owner with adequate training or monitoring infrastructure.
The Team Metrics Principle
Measuring quality outcomes without measuring team performance is like measuring product quality without measuring process capability.
The outcome tells you the result. The team metric tells you why the result is what it is — and what to improve to get a different result next time.
Back to hub: Teamwork in Total Quality Management.
| ||||||||||||||||||||||
The Continuous Improvement Certification at InArtifexYou gives you a complete, practical system to map, baseline, improve, and sustain any process — and the verified credential to prove you can lead it.
inartifexyou.com/continuous-improvement-certification-online.html | ||||||||||||||||||||||
|