Visual management in TQM: how to communicate quality
at the point of work
Visual management in TQM communicates quality status, standards, and performance at the exact location where work is performed — eliminating the need to search for information, attend a meeting, or read a report to understand current quality conditions. The five levels of visual management in quality environments are: Level 1 — Indicators (status is visible — a color, a signal, or a label that shows whether a condition is normal or abnormal), Level 2 — Standards (the correct way to perform the work is visible at the workstation — a procedure, a specification, or a reference sample), Level 3 — Controls (the workspace is designed so that abnormal conditions are impossible or immediately visible), Level 4 — Alarms (an abnormal condition automatically triggers a visible or audible signal — like an Andon system), and Level 5 — Mistake-proofing (the process physically prevents the defect from occurring — no visual interpretation required).
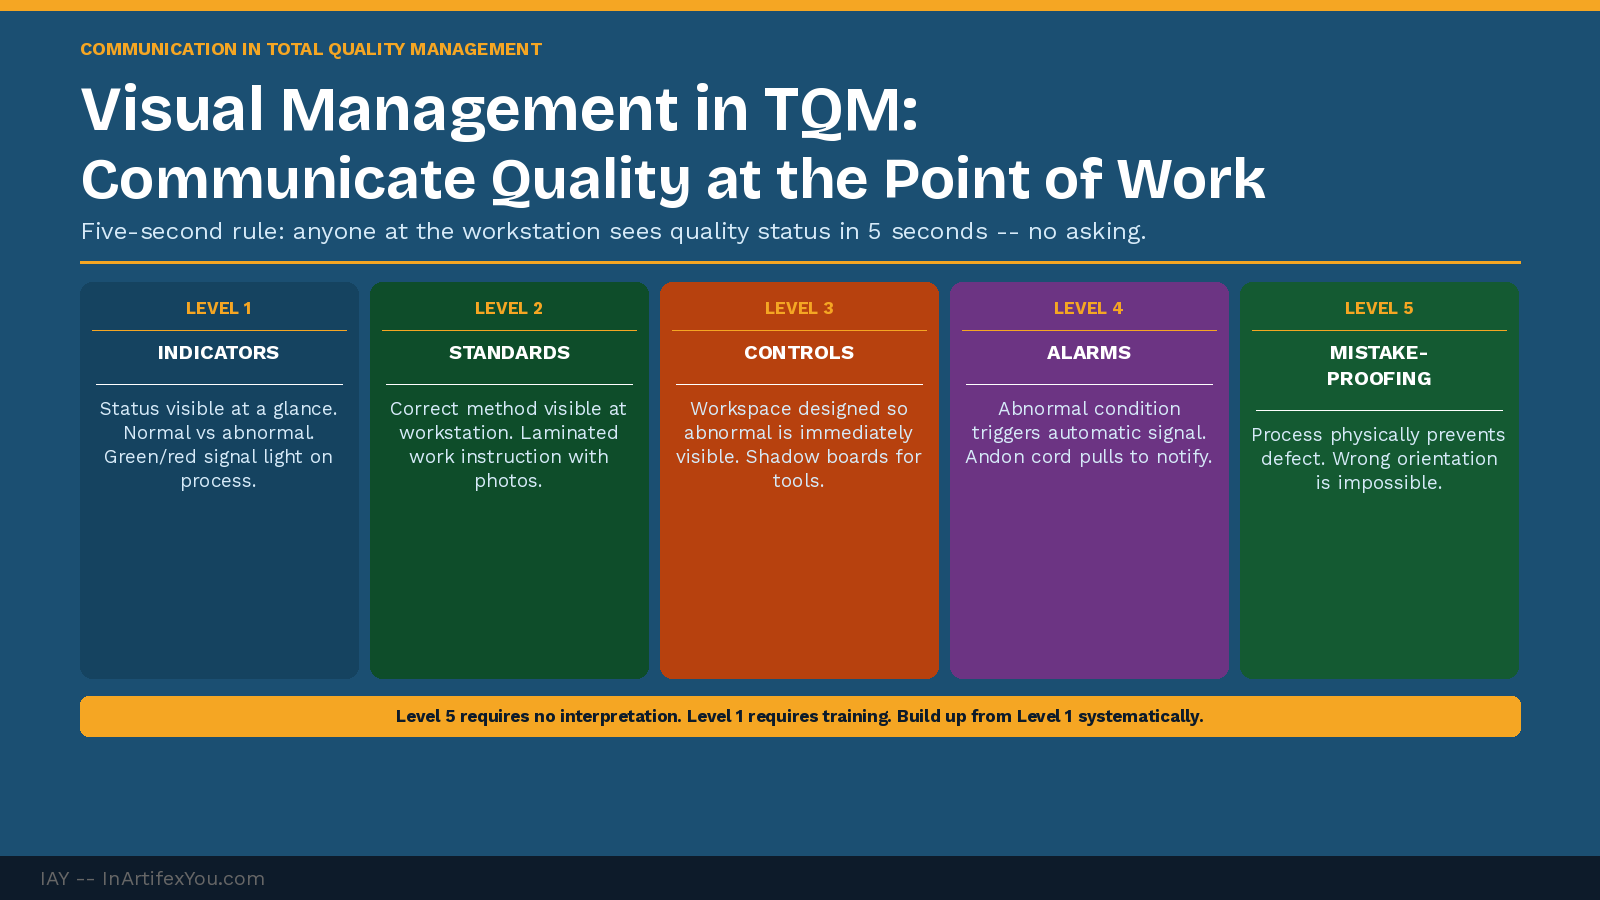
Visual management in TQM converts quality information from a communication challenge into a spatial design challenge. Instead of asking 'how do we tell people about quality?' the question becomes 'how do we make quality status, standards, and performance impossible to miss at the point of work?' The most effective visual management systems require no explanation — the normal condition and the abnormal condition are self-evident to anyone standing at the workstation.
The Five Visual Management Levels
|
Level |
Type |
Description |
TQM Example |
|
1. |
Indicators. |
Status is visible — normal vs abnormal at a glance. |
Green/red signal light on machine showing process in/out of control. |
|
2. |
Standards. |
The correct method is visible at the workstation. |
Laminated work instruction with photos at each assembly station. |
|
3. |
Controls. |
Workspace designed so abnormal conditions are immediately visible. |
Shadow boards showing tool locations — missing tool instantly visible. |
|
4. |
Alarms. |
Abnormal condition triggers automatic visible/audible signal. |
Andon cord — operator pulls to signal quality or safety issue. |
|
5. |
Mistake-proofing. |
Process physically prevents defect from occurring. |
Fixture that only accepts part in correct orientation — wrong orientation impossible. |
Visual Quality Dashboard Design
A visual quality dashboard at the team or workstation level should communicate five things instantly — without reading a report:
- Current performance vs target: defect rate, first-pass yield, or customer complaints — displayed as a trend with the target line visible.
- Status of the process: is the process currently in control or out of control? Green = normal, Red = abnormal, Yellow = warning.
- Top quality issue: the single largest current quality problem — visible to everyone as the shared improvement priority.
- Improvement project status: what is being worked on to improve quality — owner, target, and current status.
- Recent quality wins: what was improved last week or last month — sustains improvement motivation and communicates that the system works.
Design Principles for Effective Visual Management
- Five-second rule: anyone standing at the workstation should be able to understand the quality status in five seconds without asking anyone.
- Normal is obvious: design the visual so that the normal condition requires no special attention — the abnormal condition is what stands out.
- Current data only: outdated charts are worse than no charts — they signal that management does not use the information. Update frequency must match the pace of the process.
- Posted at point of use: a quality standard displayed at a different location from where the work is performed is not a visual management tool — it is a document.
The Visual Management Principle
A quality standard that requires someone to go somewhere else to find it is not a standard — it is a policy.
Visual management places the standard, the status, and the expectation at the exact location where the decision is made and the action is taken.
Back to hub: Communication in Total Quality Management.
| ||||||||||||||||||||||
The Continuous Improvement Certification at InArtifexYou gives you a complete, practical system to map, baseline, improve, and sustain any process — and the verified credential to prove you can lead it.
inartifexyou.com/continuous-improvement-certification-online.html | ||||||||||||||||||||||
|